Should you calculate Cpk when your process is not in control?
If a process is unstable, capability analysis will be unreliable. If special causes are present in the control chart, the Cpk value should not be relied upon.
The AIAG Statistical Process Control reference manual (p. 13) states:
“The process must first be brought into statistical control by detecting and acting upon special causes of variation. Then its performance is predictable, and its capability to meet customer expectations can be assessed. This is the basis for continual improvement.”
True, but to take it one step further, if the process is not in a state of statistical control then the capability of the process and the validity of a Cpk value is questionable.
Suppose your customer requires you to provide a Cpk value and does not require control charts. Or perhaps the customer is willing to accept a lack of control as long as the Cpk is acceptable. You provide a “good” Cpk number and relax, knowing that your customer is satisfied. But have you really satisfied your customer’s need, which is to ensure that your product or service is capable of performing within an acceptable specification region and performing consistently over time?
It is certainly possible to calculate Cpk and other process performance indices even when a process is not in control, but one might ask what value this calculation provides. Rather than state “You should never calculate Cpk when the process is out of control,” I prefer to say that the less predictable your process is, the less meaningful Cpk is or the less value Cpk carries. While it is easy to say that one should never calculate Cpk when the process is out-of-control, it is not always practical, since customers may dictate otherwise.
One of the reasons that minimal emphasis should be placed on Cpk when the process is not in control is predictability. Customers want good Cpk values as well as some confidence that, in the future, Cpk will be consistent or improved over previous capability studies. Another reason that you should not put too much weight on Cpk when the process is not in control is due to the underlying statistics that are used in calculating Cpk. Since Cpk is using the range, a process can appear “better” simply because the range being used is not a fair representation of the process variability when the process is not in control or predictable. If the process is in control, one could conclude that the range is sufficient for calculating Cpk.
A hypothetical example might clarify the point:
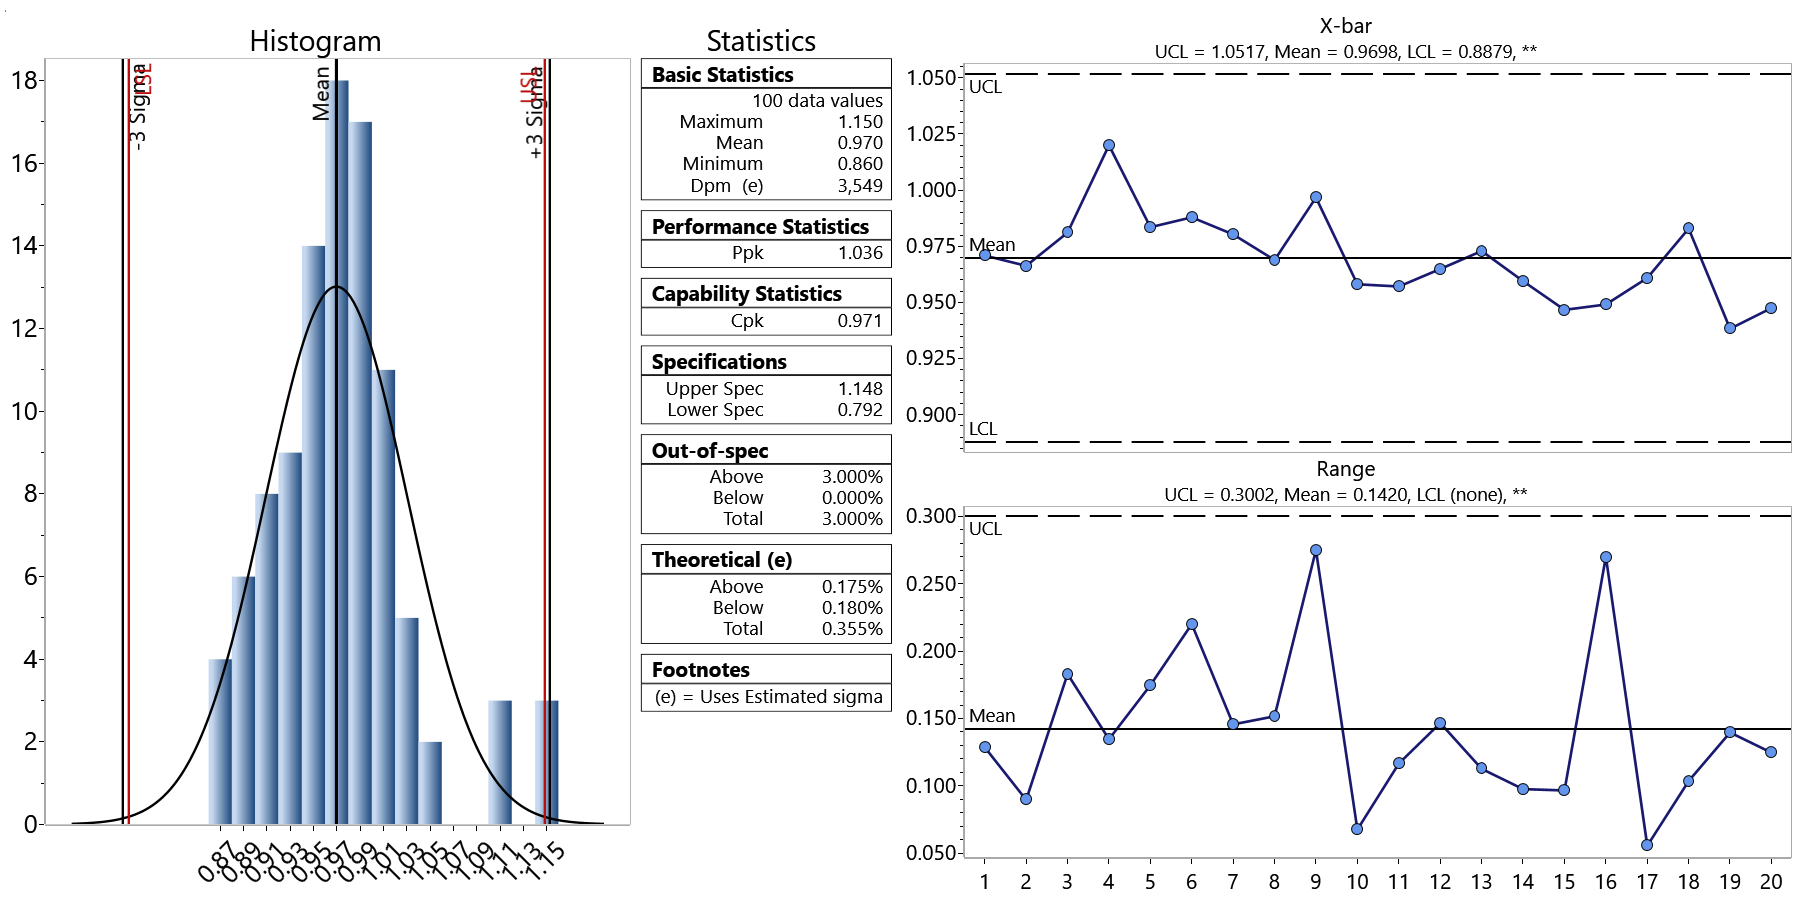
Suppose I have 100 pieces of data that are grouped into units of 5 each. The chart below shows how a control chart and histogram of the data might look. In this example, the control chart shows that the process is in control, and the Cpk = 0.971.
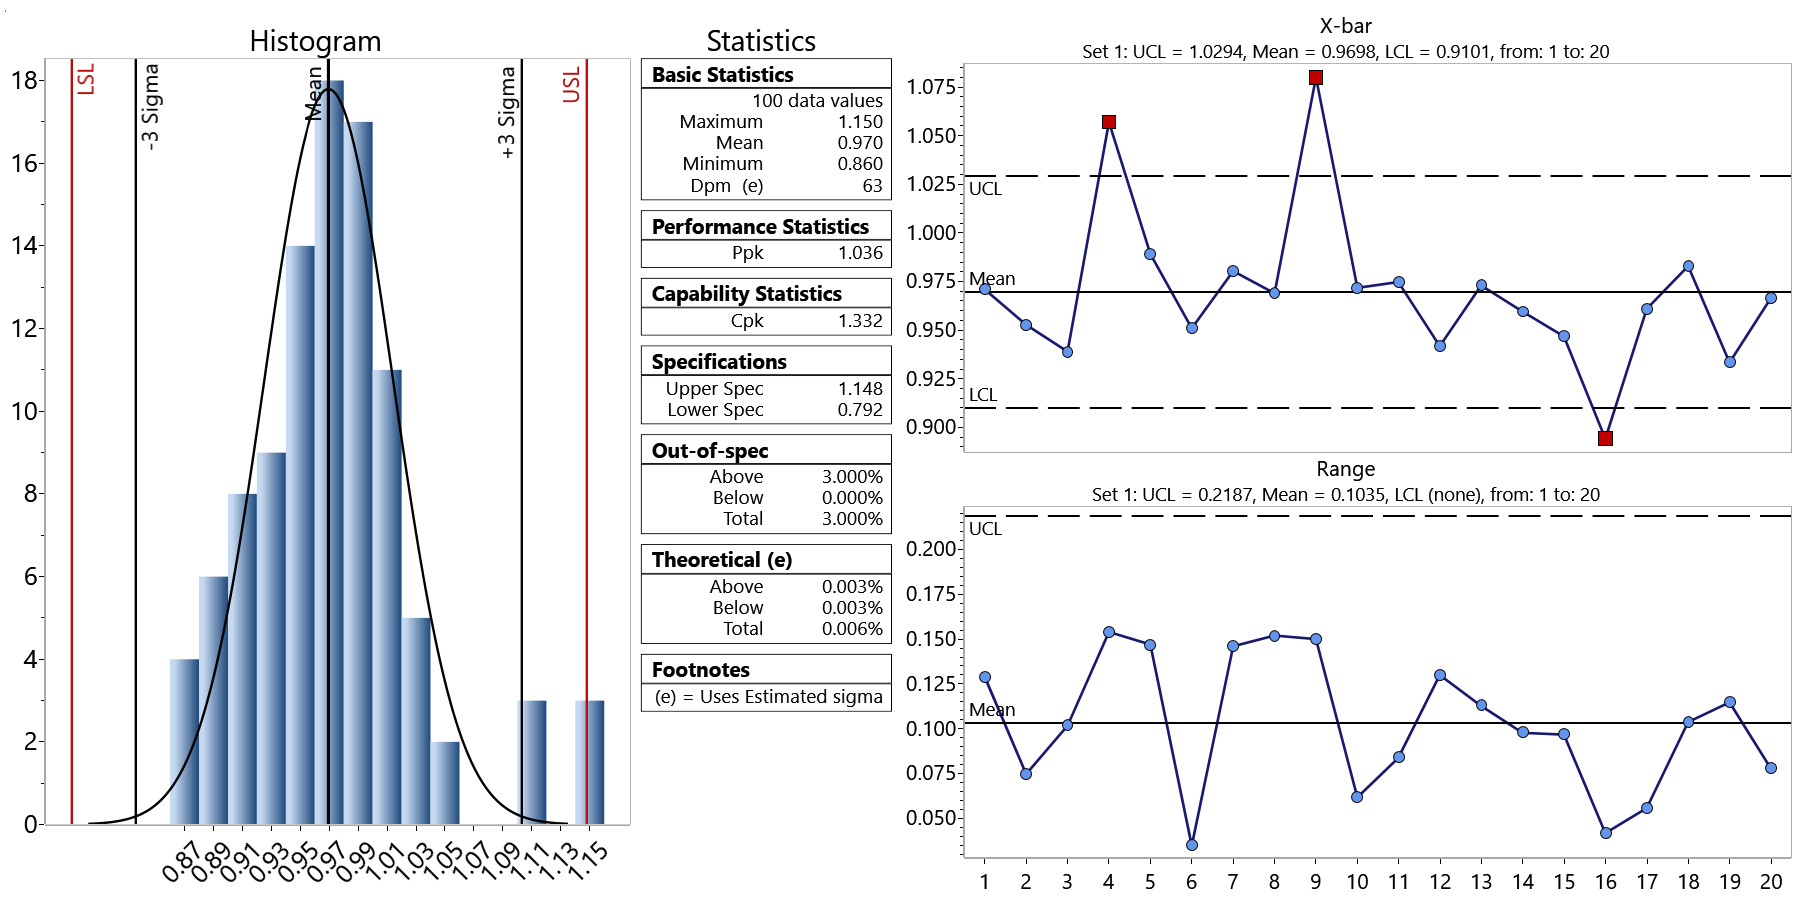
Suppose I am evaluating another process for capability and control whose mean and specifications are the same, but whose Cpk = 1.33. Most of us would want to have the second process with the higher Cpk, but is the quality of the process necessarily better? Unless you determine whether the process is in statistical control, you cannot fairly answer this question.
As it turns out, the data is exactly the same, but what has changed is the order in which the data was grouped in the samples. This caused the range of the subgroups and R-bar (the average range) to be different. In the second data set, the data was rearranged so that the data within the sample is similar. The sigma of the individuals does not change, but the estimated sigma, which is used in the control limits and Cpk calculations, changes between the two distributions.
With this example, determining if the process is in control before looking at Cpk pays off. Since the control chart in the second example, shown below, is not in statistical control, you cannot be sure that its Cpk is a good representation of process capability. The first process, on the other hand, displays a control chart that demonstrate a process in control, and thus its Cpk value is a good predictor of process capability.
If you do not have the control chart to evaluate for process control, you might be tempted to select the second process as being “better” on the basis of the higher Cpk value. As this example illustrates, you cannot fairly evaluate Cpk without first establishing process control. You can use software such as SQCpack to create control charts, draw histogram charts, and calculate capability indices such as Cpk.